ES
 RU
 DE
 PL
 IT
 TR
 FR
 BR
 NL
 CN
 CZ
 UA
 HU
 SE
 Unlimited Downloads
 Sale
Team Analytics and KPI Dashboard UI
 Sales:
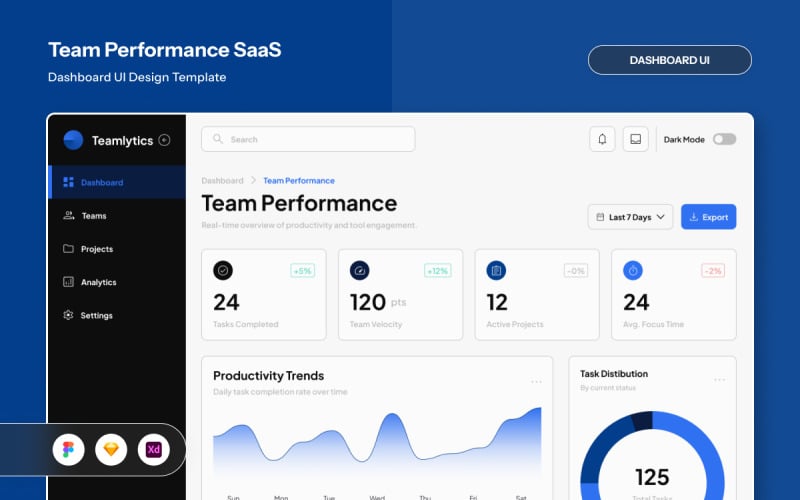


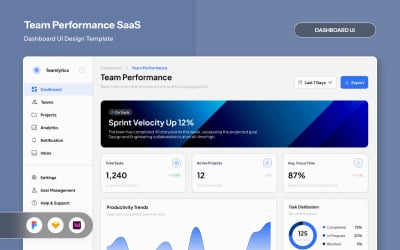
Designed for data-driven teams, this dashboard focuses on clarity, precise measurement, and actionable insight. It translates complex Key Performance Indicators (KPIs), trends, and business results into a structured, easy-to-read layout. The design ensures that even the most complex data sets remain intuitive and accessible, allowing teams to monitor performance and identify growth opportunities at a glance.
Ideal for analytics platforms and performance-focused teams, this UI supports informed decision-making through organized data presentation and a consistent visual hierarchy. Every element is meticulously crafted to reduce data fatigue, providing a sophisticated and professional environment for tracking strategic metrics and driving operational excellence across modern digital platforms.
**Highlights:**
- Responsive Modern dashboard designs (Desktop, Tablet, & Mobile version)
- Fully customizable and easy-to-edit components
- Well-organized and neatly structured layers
- Uses open-source fonts for flexibility
- Included file formats: `.fig`, `.sketch`, `.xd`
- Global text and color styles for consistency
- Compatible with Figma, Sketch, and Adobe XD
**Important Notes:**
- Images shown in the preview are for demonstration purposes only and are NOT included in the final download.
- ? This is a UI/UX design template ONLY. It does NOT include coding, backend functionality, or development files.
0 Reviews for this product
0 Comments for this product