ES
ES RU
RU DE
DE PL
PL IT
IT TR
TR FR
FR BR
BR NL
NL CN
CN CZ
CZ UA
UA HU
HU SE
SEBusiness Dashboard Google Slide Template
6 months of support
![]() With a product you will get 6 months of support from the author. To know more about what is included, please read the support policy.
With a product you will get 6 months of support from the author. To know more about what is included, please read the support policy.
![]() Sales:
Sales:
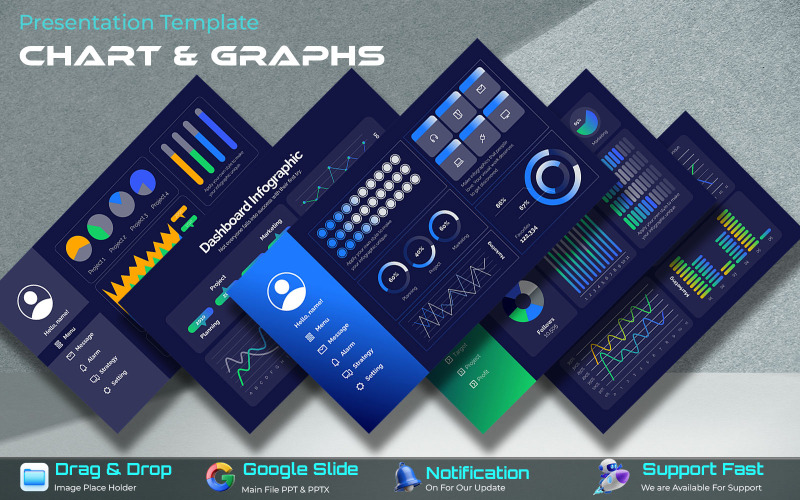
A dashboard business presentation is a visual report that summarizes key business performance indicators (KPIs), metrics, and other critical data points in a concise and easily digestible format. It typically uses charts, graphs, and tables to present information, allowing stakeholders to quickly grasp trends, identify areas for improvement, and make data-driven decisions.
Key aspects of a dashboard business presentation:
- Visual Representation:
- Dashboards use visual elements like charts, graphs, and tables to represent data, making it easier to understand and interpret compared to raw data or text-heavy reports.
- Key Performance Indicators (KPIs):
- Dashboards highlight the most important metrics that are relevant to the specific business area or project being monitored.
- Consolidated Information:
- Dashboards consolidate data from various sources into a single view, providing a comprehensive overview of performance.
- Data-Driven Decision Making:
- By providing clear and concise insights, dashboards empower stakeholders to make informed decisions based on the data presented.
- Customization and Interactivity:
- Dashboards can be customized to display specific data points and can offer interactive elements, allowing users to drill down into details or filter data based on their needs.
0 Reviews for this product
0 Comments for this product